2019 Light Vehicle Materials Report
This report presents the latest results of an assessment of the chemistry and other materials make-up of light vehicles, a major end-use customer for North American chemistry. For the purposes on this report, North America includes the United States, Canada, and Mexico. With 16.81 million light vehicles assembled in North America during 2018 this important market represents the equivalent of some $56.1 billion in chemistry. This 2018 value has increased significantly from 2008 during the recession, when 12.65 million units were assembled and the associated chemistry value was $24.6 billion.
Plastics and Polymer Composites in Light Vehicles
Light vehicles represent an important market for plastics and polymer composites, one that has grown significantly during the last five decades. The average North American light vehicle now contains 351 pounds of plastics and polymer composites, 8.8% of the total weight. Although this is off from the prior peak in 2009, it is up from 343 pounds in 2010, 279 pounds in 2000 and 156 pounds in 1990. In 1960, less than 20 pounds were used. The typical light vehicle may contain over than 1,000 plastic parts.
Composites are any combination of polymer matrix and fibrous reinforcement. Glass, carbon, aramid, and other fibers provide strength and stiffness while the polymer matrix (or resin) of polyester, polyurethane, epoxy, polypropylene, nylon, or other resin protects and transfers loads between fibers. This creates a material with attributes superior to polymer or fiber alone. In recent years, carbon fiber-reinforced composites have made inroads into light vehicle applications.
Plastics and polymer composites have been essential to a wide range of safety and performance breakthroughs in today’s cars, minivans, pickups and SUVs. Today’s plastics typically make up 50% of the volume of a new light vehicle but less than 10% of its weight, which helps make cars lighter and more fuel efficient, resulting in lower greenhouse gas emissions. Tough, modern plastics and polymer composites also help improve passenger safety and automotive designers rely on the versatility of plastics and polymer composites and the aesthetic possibilities when designing today’s vehicles. In addition, many plastic resins are recyclable.
 Automotive Body Exterior –Plastics and polymer composites have revolutionized the design of body exteriors. From bumpers to door panels, lightweight plastic provides vehicles with better gas mileage and allows designers and engineers the freedom to create innovative concepts that otherwise would be impossible. In the past, metals were synonymous with auto body exterior design and manufacturing. They are, however, susceptible to dents, dings, stone chips and corrosion. They are also heavier and more expensive than plastics. Specifying plastics and composites for automotive body exterior panels and parts allows manufacturers to adopt modular assembly practices, lower production costs, improve energy management, achieve better dent resistance, and use advanced styling techniques for sleeker, more aerodynamic exteriors.
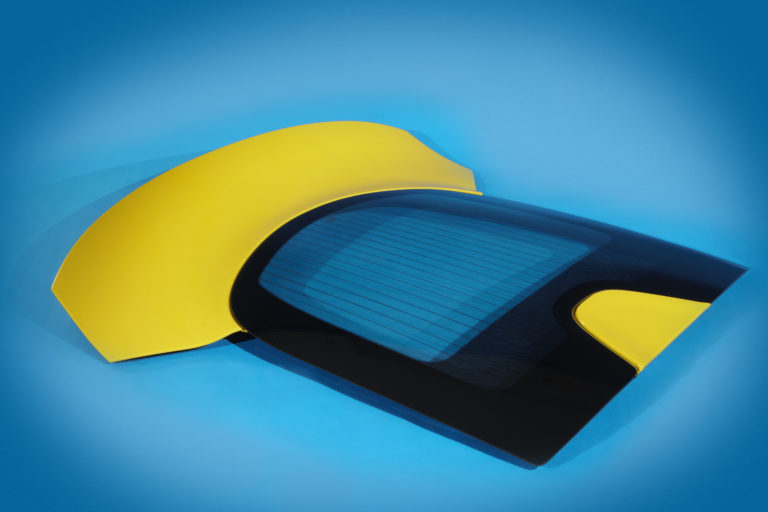 Automotive Safety – The versatility of plastics allows design options that reduce vehicle weight while producing safer vehicles. Included are plastic composite structures in the front end of a vehicle that reduce vehicle weight without compromising safety and plastic components in crumple zones that help absorb energy while lowering vehicle weight. Plastics are also used in door modules to maintain or improve side impact safety, plastic layers in automotive safety glass prevent passenger injuries, and plastic foams can add strength to automotive body cavities and increase occupant safety in vehicles.
 Automotive Electrical Systems – Over the last 20 years, the electrical systems of light vehicles have undergone a major revolution. Automotive electrical and electronic system components are now more numerous and important with computer chips regulating and monitoring ABS brakes, fuel injection, and oxygen sensors, GPS navigation equipment, obstacle sensors, state-of-the-art audio systems, and other systems. Plastics make possible the inclusion, operation, interconnection and housing of sockets, switches, connectors, circuit boards, wiring and cable, and other electrical and electronic devices.
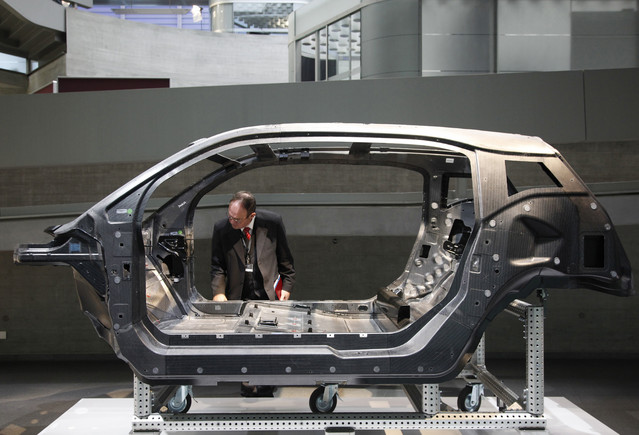 Automotive Chassis – A chassis is the supporting frame of a light vehicle. It gives the vehicle strength and rigidity, and helps increase crash-resistance through energy absorption. The chassis is especially important in ensuring low levels of noise, vibration and harshness (NVH) throughout the vehicle. Not only does a reduction in NVH allow for a more pleasant driving experience, but by putting less stress on connecting components it can help increase the life span of these components. The key determinant permitting reduced levels of NVH is energy absorption. As a result, passenger protection can be enhanced in the event of a collision. Plastics are making inroads into the chassis market. Innovations in plastic technology have brought about the development of successful chassis applications and structure, support and suspension performance.
 Automotive Powertrains – The powertrain is one of a light vehicle’s most complicated parts. The term “powertrain” refers to the system of bearings, shafts, and gears that transmit the engine’s power to the axle. Included are composite drive shafts that increase torque. Plastics help reduce the number of parts needed to assemble these complex components. Plastics also help reduce vehicle weight, which helps lower assembly costs while increasing fuel efficiency. For example, the utilization of lightweight plastics in a vehicle can allow manufacturers to utilize smaller, lighter weight engines.
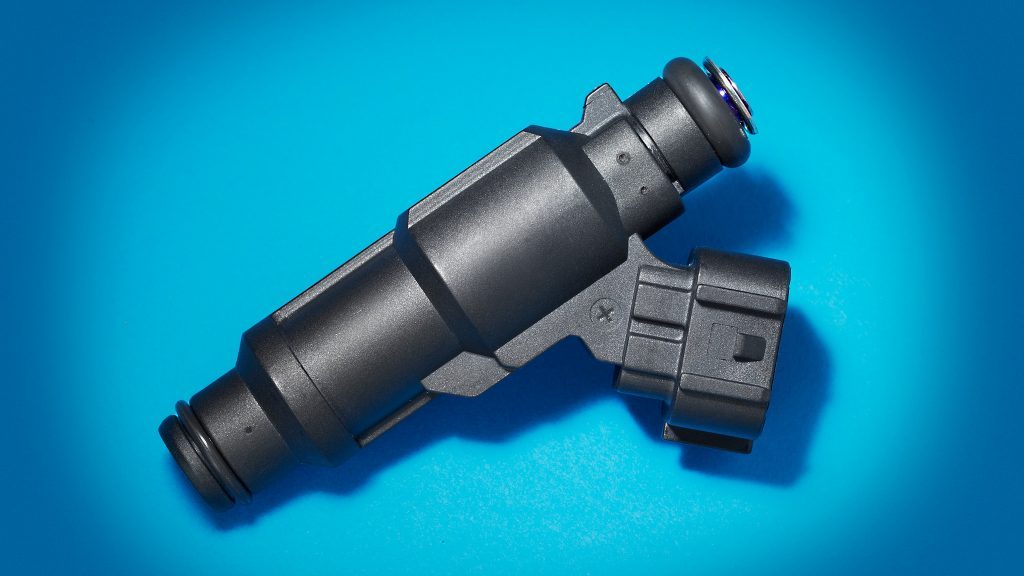 Automotive Fuel Systems – For automotive fuel system components, plastics have several advantages that enable it to outperform metals. Plastic frees engineers from the design constraints that metal imposes. Plastic’s light weight makes vehicles more fuel-efficient and from a safety standpoint, rupture-resistant plastics with high impact strength are helping keep automotive fuel tanks and related delivery systems leak-proof, corrosion-resistant, and reliable.
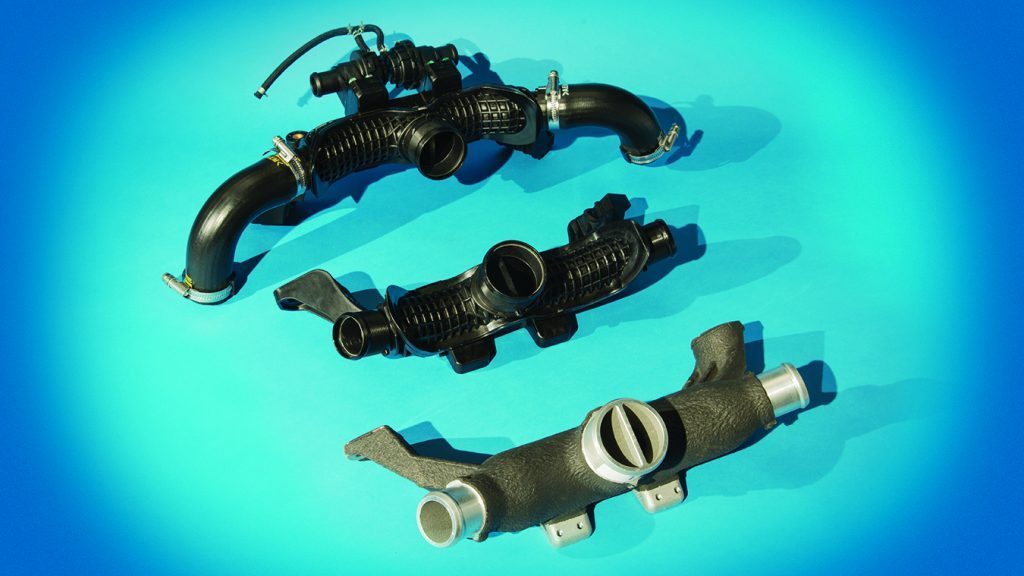
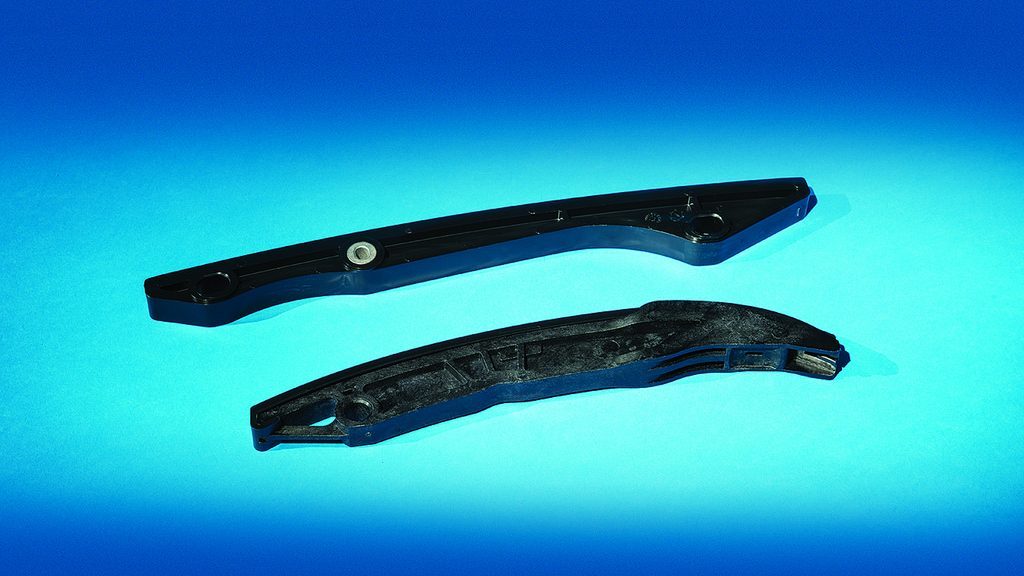 Automotive Engine Components – Many of today’s automotive engine components are plastic. From air-intake manifolds and systems to cooling systems to valve covers and other engine parts, plastic helps make engine systems easier to design, easier to assemble, and lighter in weight. Plastics’ versatility has revolutionized automotive engine component design.
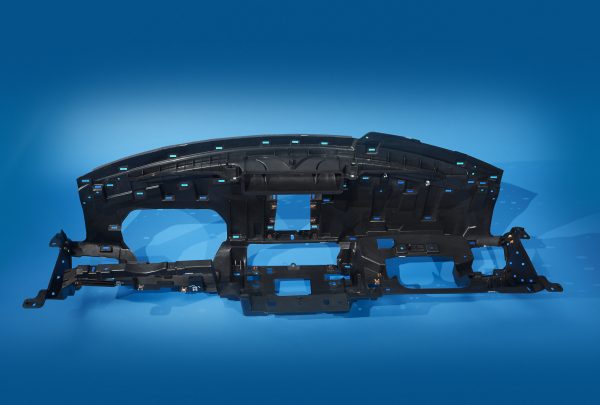 Automotive Interior – The elements of automotive interior design — comfort, noise level, aesthetic appeal, ergonomic layout, and durability — have a great effect on a consumer’s purchasing decision. Plastic automotive interior parts address all of these aspects, and more, in a remarkably effective and efficient manner.
The automotive market is an important market for plastic resins such as nylon (polyamides), other engineering polymers, and thermoplastic polyesters. Light vehicle applications often account for over 30% of the demand for each resin. Other resins include ABS and polyvinyl butyral. For the latter resin which is used in safety glass, the automotive market accounts for over 85% of total demand. Engineering polymers such as nylon, polycarbonate (and polycarbonate blends) and others are supplanting metals in many applications. Typical plastics and composite applications include exterior panels, trim, and bumper fascia, as well as interior trim panels, window encapsulation, headlamp housings, manifolds and valve covers, electronic/electric parts and components, wiring harnesses, steering wheels, insulation, dampening and deadeners, upholstery, mechanical parts and components, safety glass, and myriad other uses.
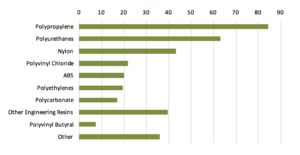
Average plastics and composites per vehicle use increased three pounds (0.9%) to 351 pounds in 2018, and plastics and composites maintained its share of the overall weight of a typical vehicle. Over 15 major resins find significant use in light vehicles. Details on resin use are presented in Tables 3 and 4. Major polymers used in light vehicles include on average 84 pounds of polypropylene (PP), 63 pounds of polyurethanes, 43 pounds of nylon, 22 pounds of polyvinyl chloride (PVC), 20 pounds of acrylonitrile-butadiene-styrene (ABS), 17 pounds of polyethylene resins, and 17 pounds of polycarbonate resins.
Polypropylene (Click thumbnail to left for full chart of primary polymers in automotive markets) is also used in thermoplastics polyolefin elastomers (TPO) and its use in that area is reported separately under rubber. Average TPO use is nearly 35 pounds per vehicle and if it were included in plastics and polymer composites the total would be the equivalent of over 385 pounds per vehicle.
Note: Polypropylene is also used in thermoplastics polyolefin elastomers (TPO) as well but its use in that area is reported separately under rubber in Table 2. TPO use averages nearly 35 pounds per vehicle. Polypropylene resin applications include interior trim, under-the-hood components, HVAC components, battery cases, and other OEM uses.
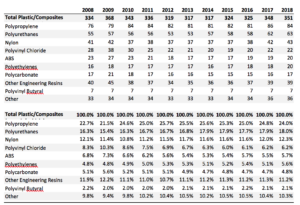 Over the last two decades, other engineering resins such as polyacetal, polyphenylene ether (PPE), and thermoplastic polyester engineering resins have supplanted metals in a number of applications. (Click thumbnail to right for full chart of Average Large Volume Plastics Content of North American Light Vehicles (pounds per vehicle)) Average use of these resins was 39 pounds in 2018, up from 38 pounds in 2010, 30 pounds in 2000, and 18 pounds in 1990. Polycarbonate and nylon are also classified as engineering resins (as are some ABS grades) and if polycarbonate and nylon resins were included, total engineering resin consumption would be 99 pounds. An average of seven pounds of polyvinyl butyral are used. Additional resins such as acrylics, phenolics, unsaturated polyester, and others account for the remaining 36 pounds.
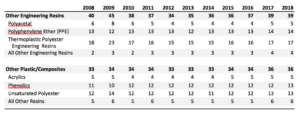 Additional opportunities to reduce weight with plastics and polymer composites are possible. (Click thumbnail to left for full chart of Average Engineering & Other Plastics Content of North American Light Vehicles (pounds per vehicle)) These include: 1) reducing the weight of existing plastic and composite parts with the use of low density additives, nanoparticles, and alternate fibers; and 2) converting more metal parts to plastics and composites. Furthermore, industry mega trends for future mobility, including self-driving vehicles and ride-sharing platforms will create numerous unique opportunities for plastics and composites due to increased safety requirements and new vehicle architectures. As a result, the light vehicle market presents significant opportunities for further diffusion of plastics and composites in the future.
Materials and Light Vehicles
The North American light vehicle industry is an important customer for a number of metal and other materials manufacturing industries. For plastics and polymer composites in particular there is significant competition with other materials, especially aluminum and steel.
In 2018, average vehicle weight increased by 0.5% (19 pounds) to 3,979 pounds. In 1990, average vehicle weight was 3,409 pounds. In 2000, the average vehicle weight was 3,873 pounds. The rising popularity of SUVs was a contributing factor in rising vehicle weight during the 1990s and for the first half of the 2000. From 2004 through 2007, average vehicle weight exceeded 4,000 pounds.
Higher gasoline prices in 2008, however, prompted a reversal of this trend and a shift to smaller, more fuel-efficient vehicles. As a result, average vehicle weight slipped to 3,960 in 2009 and to 3,865 in 2010. An economic recovery and renewed popularity of larger vehicles in combination with lower gasoline prices then fostered increases in weight. Offsetting this is further penetration by plastics and composites and other lightweight materials which reduces average vehicle weight.
The performance of vehicles has improved significantly over the years. According to EPA data, for example, the average horsepower (HP) of model 2018 vehicles was 237 HP, compared to 214 HP In 2010, 181 HP in 2000 and 135 HP in 1990. Average fuel efficiency now averages 25.4 miles per gallon (MPG) compared to 22.6 MPG in 2010, 19.8 MPG in 2000 and 21.2 MPG in 1990. Although vastly improved engine technologies have played a role, so have chemistry and lightweight materials.
Regular steel and high- and medium-strength steel are the dominant materials in light vehicles. Combined, this steel accounts for slightly less than 50% of vehicle weight. High- and medium-strength steel have been gaining share away from regular steel. In addition, hot-stamping offers many advantages and has supported steel use. Other steel and iron castings have generally lost share. Combined, all iron and steel (including castings) accounted for 59% of average vehicle weight, down from 60% in 2010, 65% in 2000, and 70% in 1990.
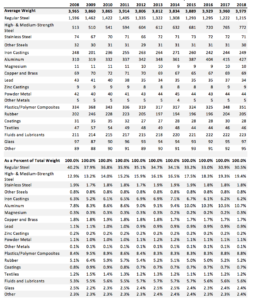 Over the last several decades, lightweight materials have gained share away from iron and steel. (Click thumbnail to left for full chart of Average Materials Content of North American Light Vehicles (pound/vehicle)) For example, aluminum gained share in 2018, rising 2.9% (or 12 pounds) to an average of 427 pounds per vehicle. This is largely the result of the newly redesigned F-150 truck, the most popular vehicle model produced. Aluminum use represented 10.7% of average vehicle weight, up from 8.6% in 2010, 6.9% in 2000 and 4.7% in 1990. During this period, other lightweight materials such as magnesium and plastics and composites have also gained market share away from iron castings, steel, lead, and other heavier materials. Details on materials used are presented in Table 2. Additional metals include copper and brass, lead, and zinc, and others in both powder and solid form. Glass, rubber, coatings, textiles, fluids and lubricants, and other materials round out the composition of a typical light vehicle.
Note: Polypropylene is also used in thermoplastics polyolefin elastomers (TPO) as well and its use in that area is reported separately under rubber. Average TPO use is about 35 pounds per vehicle.
Chemistry and Light Vehicles
The light vehicle industry represents a large share of the North American economy, totaling more than $431 billion in shipments (at the manufacturer’s level) in 2018 and employing 1.45 million workers. The light vehicle industry continues to be an important customer for most manufacturing industries, including the chemical industry. This relationship is particularly strong in basic and specialty chemicals because every light vehicle produced in the United States, Canada and Mexico contains $3,336 of chemistry (chemical products and chemical processing). The chemistry value per vehicle has grown considerably over the past 10 years, having grown 15% since 2008 when it was $2,906 per vehicle. Included in the chemistry value, for example, are antifreeze and other fluids, catalysts, plastic instrument panels and other components, rubber tires and hoses, upholstery fibers, coatings and adhesives. Virtually every component of a light vehicle, from the front bumper to the rear tail-lights features some chemistry.
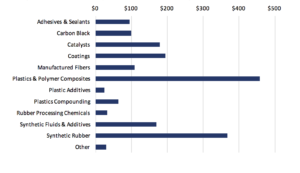 The average values of direct chemistry content in North American light vehicles in 2018 (Click thumbnail to left for full chart of Average Value of Direct Chemistry Content of North American Light Vehicles in 2018 ($/vehicle)) for a variety of segments of the business of chemistry are presented in Figure 1 (measured in dollars per vehicle). Only details on the direct chemistry value of materials are presented (the chemistry value from processing and other indirect chemistry is not displayed).
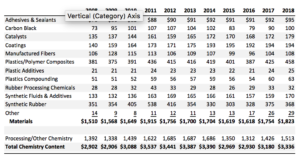 The direct chemistry value during 2018 (Click thumbnail to right for full chart of Average Value of Chemistry Content of North American Light Vehicles ($/vehicle)) averaged $1,823 per vehicle, 55% of the total chemistry value. Details on chemistry used are presented in Table 1. The remaining 45% (or $1,513 per vehicle) was from processing and other indirect chemistry (for example, glass manufacture uses soda ash and other processing chemicals).
Other Chemical Products and Light Vehicles
A variety of other products of chemistry are used in the manufacture of North American vehicles. Most chemistry is used in processing and other indirect chemistry (e.g., soda ash in glass manufacture) but also 279 pounds of rubber, textiles and coatings are used as well.
The typical light vehicle utilizes, on average, 205 pounds of rubber, mainly in tires but also in non-tire applications such as belts and hoses, and other components. Natural rubber is used but by far the most widely used rubber is styrene-butadiene rubber (SBR) which is used in tire and a variety of non-tire applications. Common uses include radiator and heater hoses, various body and chassis parts, bumpers, weather-stripping, door and window seals, mats, grommets, tubes, fan belts and various molded and extruded goods. Thermoplastic polyolefin elastomers (TPO) are another widely used elastomer. Applications include a wide variety of exterior, interior and under-the-hood and chassis applications. Combined, natural rubber, SBR and TPO elastomers account for three-fourths of overall rubber consumption. Other elastomers include butyl rubber, chlorinated polyethylene, chlorosulfonated polyethylene, copolyester-ether, ethylene-propylene, nitrile, polybutadiene, polychloroprene (neoprene), polyisoprene, polyurethane, silicone, styrenic thermoplastics and other elastomers. Changes in tire design since the 1970s have resulted in less vehicle weight devoted to tires, resulting in some fuel savings since then. In recent years, longer-lasting, low- rolling-resistance tires and new materials have been developed and as these products penetrate markets, fuel performance should be enhanced.
The typical light vehicle utilizes 46 pounds of manufactured fibers, primarily synthetic fibers. Very few natural fibers are used and rayon and melamine fiber use has largely disappeared. Most notable synthetic fibers are traditional woven fibers of nylon and polyester but also non-woven fabrics of polypropylene and polyester used in various facings, backings, liners, acoustic panels, reinforcements and panels, and automotive filters. These fibers are derived from hydrocarbons. In recent years, traditional textiles are being supplanted by polyurethanes. Carbon fiber is typically blended with plastics to create carbon fiber reinforced plastics (CFRP) for automotive applications. Carbon fiber’s high-strength but very low weight properties can play a major role in automakers’ efforts to reduce vehicle weight.
The typical North American light vehicle also featured 28 pounds of coatings (dry weight) in 2018. In automotive applications, coatings enhance value by making the vehicle attractive and protecting it. Without coatings, vehicles would quickly rust, be dull in appearance, and have a very short service life. Light vehicle applications include topcoats, primers and coatings for underbody components and include solvent-borne, water-borne and powder coatings. Powder coatings are based mainly on epoxy and polyester resins, which upon heating react with curing agents to form very durable coatings that emit virtually zero VOCs (volatile organic compounds). These have gained in use relative to traditional solvent-borne coatings in recent decades. Coatings use has declined in recent years because of reduced waste generation during application, thinner coatings, and the switch to higher solids coatings as well as greater plastics and polymer composite use.
In addition to these materials, chemistry also plays a role in the 223 pounds of fluids and lubricants that a typical light vehicle contains. These include engine oil lubricants, transmissions fluids, windshield wiper fluids, refrigerants for air conditioners, and other products. All of these contain chemical additives to enhance performance while others such as fluorocarbon refrigerants are products of chemistry. In engine oil lubricants, synthetic lubricants are gaining market share away from traditional petroleum products.
Economics and Statistics Department
The Economics & Statistics Department provides a full range of statistical and economic advice and services for ACC and its members and other partners. The group works to improve overall ACC advocacy impact by providing statistics on American Chemistry as well as preparing information about the economic value and contributions of American Chemistry to our economy and society. They function as an in-house consultant, providing survey, economic analysis and other statistical expertise, as well as monitoring business conditions and changing industry dynamics. The group also offers extensive industry knowledge, a network of leading academic organizations and think tanks, and a dedication to making analysis relevant and comprehensible to a wide audience.
Dr. Thomas Kevin Swift, CBE
Chief Economist and Managing Director
202.249.6180
kevin_swift@americanchemistry.com
Martha Gilchrist Moore, CBE
Senior Director – Policy Analysis and Economics
202.249.6182
martha_moore@americanchemistry.com
Heather R. Rose-Glowacki, CIP®-II
Director, Chemical & Industry Dynamics
202-249-6184
heather_rose@americanchemistry.com
Emily Sanchez
Director, Economics & Data Analytics
202.249.6183
emily_sanchez@americanchemistry.com
Zahra Saifi
Executive Assistant – Office of CFO and CAO
202.249.6162
zahra_saifi@americanchemistry.com
Appendix: Data Sources and Methodology
The information presented in this report is an update building on ACC’s earlier assessments of materials use per vehicle. Those previous assessments depended upon the materials use per vehicle data supplied by American Metal Market with some adjustments for non-automobile light vehicles (SUVs, light-duty trucks, mini-vans, etc.) The reporter who tabulated this data, however, retired and the data are no longer available. The assessment presented here reflects an attempt to resurrect and re-estimate the data for materials use per vehicle. While the original data reflected typical domestic automobile use of materials, the present assessment reflects the average for all light vehicles on an OEM (original equipment manufacturer) basis. The analysis also builds upon research on automotive high-tech materials initiated during the 1980s (and since maintained) by Dr. TK Swift, the primary author of this analysis.
A “bottoms-up” approach was taken by examining light vehicle use by type of material. We examined over 70 distinct materials. The data for the materials use were provided by trade associations and government statistical agencies. Data sources include The Aluminum Association, American Composite Manufacturers Association, American Iron & Steel Institute, Copper Development Association, International Magnesium Association, and the Rubber Manufacturers Association. The provision of data and advice from these associations are gratefully acknowledged. Data from the Bureau of the Census and the US Geological Survey were also used.
The plastics and composite data are derived from the American Chemistry Council’s Plastics Industry Producers’ Statistics (PIPS) service, which provides relevant, timely, comprehensive and accurate business statistics on the plastic resins industry. This was supplemented by an exhaustive search of the trade literature. The averages are calculated using an assessment of the material consumed with adjustments made to take into account replacement demand. The sum of the individual materials data are close to the comparable average vehicle data provided by the Environmental Protection Agency (EPA) and the Office of Energy Efficiency and Renewable Energy (EERE) of the US Department of Energy (DOE).
The data represent the average use of materials for light vehicles assembled in the United States, Canada, and Mexico.
Every effort has been made in the preparation of this publication to provide the best available information. However, neither the American Chemistry Council, nor any of its employees, agents or other assigns makes any warranty, expressed or implied, or assumes any liability or responsibility for any use, or the results of such use, of any information or data disclosed in this material.


